

From Data to Decisions: How Moving Averages Can Guide Your Small Business Decisions
From Data to Decisions: How Moving Averages Can Guide Your Small Business Decisions

A moving average is a statistical method used to analyze data points by creating a series of averages of different subsets of the full data set.
In other words, it is used to smooth out fluctuations in data and to identify trends or patterns that might not be immediately apparent.
There are two main types of moving averages:
Simple moving averages (SMA)
A simple moving average is calculated by taking the average of a set number of data points, such as the last 10, 20, or 50 data points.
For instance, if we have a set of 10 stock prices and we want to calculate a 10-day SMA, we would add up the prices for the last 10 days and divide by 10 to get the average price.
This average would then be plotted on a chart along with the stock prices, giving us a visual representation of the trend in the data.
Example SMA: Sales data
The simple moving average can be a useful tool for small businesses in making decisions.
For example, let's say you run a small retail store and you're trying to decide whether to increase or decrease the prices of certain products.
By calculating the simple moving average of sales data, you can gain insights into whether a product's sales are increasing or decreasing over time.
Here's an example:
Let's say you want to analyze the sales trends for a particular product over the past 30 days.
You would start by gathering the sales data for that product over the past 30 days, which might look something like this:
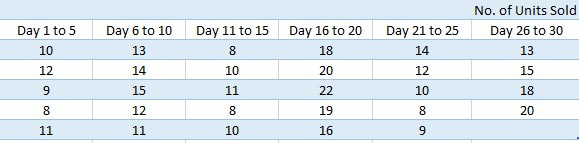
To calculate the simple moving average of sales for this product over the past 30 days, you would add up the sales for the past 30 days and divide by 30:
(10 + 12 + 9 + 8 + 11 + 13 + 14 + 15 + 12 + 11 + 8 + 10 + 9 + 13 + 16 + 18 + 20 + 22 + 19 + 16 + 14 + 12 + 10 + 8 + 9 + 11 + 13 + 15 + 18 + 20) / 30 = 13.4
So the 30-day simple moving average of sales for this product is 13.4 units per day.
By comparing the current sales of the product to this moving average, you can gain insights into whether sales are increasing or decreasing over time.
If the current sales are consistently above the moving average, it may be a good time to increase the price of the product.
If the current sales are consistently below the moving average, it may be time to decrease the price to stimulate demand.
Exponential moving averages (EMA)
An exponential moving average gives more weight to more recent data points and less weight to older data points.
This means that an EMA will respond more quickly to changes in the data and will be less affected by fluctuations in the data.
For example, if we have a set of 10 stock prices and we want to calculate a 10-day EMA, we would start by calculating a simple moving average for the first 10 days.
Then, for each subsequent day, we would calculate a new average by adding a portion of the current day's price to the previous average, with the portion determined by a smoothing constant.
Example EMA: Sales data
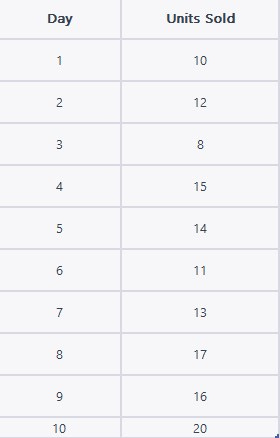
Let's say a small business wants to calculate the exponential moving average of its daily sales data over the past 10 days. The business has the following sales data:
To calculate the exponential moving average, the business can use the following formula:
EMA = (Close - EMA(previous day)) x multiplier + EMA(previous day)
Where:
Close = the closing price (in this case, the units sold) of the current day
EMA(previous day) = the exponential moving average of the previous day
Multiplier = smoothing factor that determines the weight given to the current day's data. A common value used for the 10-day EMA is 0.1818.
Using the above formula, the exponential moving average for Day 1 will be the same as the closing price, which is 10. For Day 2, the calculation is:
EMA(Day 2) = (12 - EMA(Day 1)) x 0.1818 + EMA(Day 1) = (12 - 10) x 0.1818 + 10 = 10.36
Similarly, the exponential moving average for each subsequent day can be calculated using the above formula. Here is the resulting table:
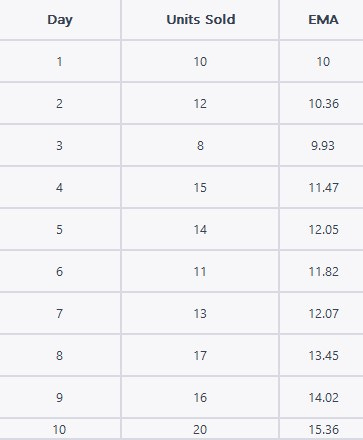
In this example, the exponential moving average provides a more responsive measure of the trend in sales data as it gives more weight to the most recent data.
What do we infer?
In the context of the example, the EMA value of 15.36 on Day 10 indicates that the sales trend has been improving over the past 10 days, and the rate of improvement has been increasing.
This is because the EMA value is higher than the previous day's EMA value and higher than the value of the initial sale on Day 1.
However, it's important to note that a single value of EMA cannot be used to draw definitive conclusions about a business's sales trend.
It is just one of the many tools that can be used to analyze sales data and make informed decisions.
Conclusion
Moving averages can be a powerful tool for small businesses looking to make data-driven decisions.
In addition to moving averages, businesses may also use other statistical tools like trend analysis and seasonal forecasting to gain a deeper understanding of their sales patterns and make data-driven decisions.
The goal is to use these tools to identify patterns, trends, and potential opportunities or challenges that the business may face in the future.
This can help businesses optimize their sales strategies, forecast future sales trends, and make informed decisions that ultimately lead to increased profitability and growth.
By tracking trends over time, business owners can gain valuable insights into their operations and make informed choices about everything from inventory management to marketing campaigns.
By incorporating moving averages into your decision-making process, you can build a more resilient and adaptable business that can weather any storm.
If you're interested in learning more about how to use data to drive your small business forward, be sure to subscribe to our newsletter for more business decision-making tools and tips.
With the right tools and strategies in hand, you can take your small business to new heights of success.